Writing reports can be a tedious and time-consuming task, especially if you’re doing it manually or using outdated software. The process of organizing data, and generating graphs can be overwhelming. Plus, the risk of error is high, which can lead to inaccuracies and delays.
Fortunately, there are several report-writing software tools available that can make this process faster, easier, and more accurate. In this blog post, we’ve compiled a list of the top 10 report-writing software on the market. Whether you’re a business owner, a student, or a professional, you’re sure to find the perfect tool for your needs.
What is report writing software?
Report writing software is a type of tool designed to assist in the creation, formatting, and presentation of professional reports. It offers features and functionalities that help users organize, analyze, and visualize data. Reporting tools also provide templates and customization options for creating visually appealing reports.
In addition, the integration support with other tools and applications also helps to streamline the report writing process and enhance the overall quality of the reports.
What is a report writer system?
A report writer system is a software tool that is specifically designed to assist individuals and organizations in creating and generating reports. These systems can be used to create a wide range of reports, such as financial reports, business performance reports, long and short reports, and more.
Some report writer systems also offer collaboration and sharing features, allowing multiple users to work on the same report simultaneously.
Why use a reporting software
Reporting software is a valuable tool for individuals and organizations who need to produce reports regularly. Whether you’re part of a software development company or a marketing agency, these tools can help ensure consistency and efficiency in data reporting.
There are several reasons why organizations and report writers should be using reporting generation software, including:
- Consistency and accuracy: Reporting software can ensure that reports are formatted consistently and accurately, reducing the risk of errors and inconsistencies.
- Customization and flexibility: Reporting software provides users with a variety of templates, formatting options, and customization features that enable them to create reports tailored to their specific requirements.
- Enhanced presentation and communication: Reporting generation tools can help users create professional-looking reports with high-quality graphics and visual aids, which can improve communication and understanding of complex data.
- Data analysis: Reporting software can be used to analyze and visualize large amounts of data, providing insights and identifying trends that might not be immediately apparent.
Criteria for Selecting a Report Writing Tool
1/ Functionality: The report writing tool should have the necessary features and functionality to meet the specific needs of the organization, such as the ability to import data from various sources, customize report templates, and create data visualizations.
2/ Support and training: The tool should have adequate customer support and training resources to ensure that users can get help when needed and maximize the value of the tool.
3/ User reviews and recommendations: It’s important to read user reviews and seek recommendations to gain insights into the tool’s effectiveness and suitability for the organization’s needs.
4/ Cost: Before finalizing any tool, it is crucial to consider the cost of the tool, including any subscription costs, to ensure that it fits within the organization’s budget.
5/ Ease of use: It is also important to evaluate the user interface and ease of use of the tool to ensure that it is intuitive and user-friendly.
6/ Security and privacy: Lastly, the platform should offer appropriate security measures in place to protect confidential data and prevent unauthorized access.
10 Best Report Writing Software & Tools to Use in 2024
As organizations strive to streamline their reporting processes, the demand for reliable and efficient report-writing tools has grown exponentially. These tools not only simplify the task of creating professional reports but also enhance productivity and collaboration among team members.
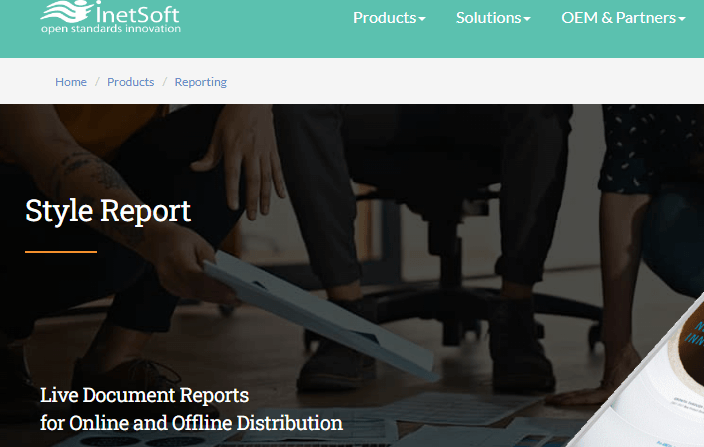
1/ Inetsoft Style Report
Overview of the tool
InetSoft.com offers a reporting software tool called Style Report that can assist users in report writing. With Style Report, users can easily design customized reports using an intuitive report designer. The tool offers drag-and-drop functionality, which enables users to add data sources, fields, and elements to their reports effortlessly.
Additionally, the tool allows users to output their reports in various formats, making it easy to share reports with others or to embed reports in other applications.
Features offered by Inetsoft Style Report
1/ Data Integration: Style Report integrates with a wide range of data sources, including databases, spreadsheets, and web services.
2/ Interactive Reports: Interactive features that allow users to filter and sort data, drill down into details, and explore data in real-time.
3/ Flexible Output: The tool allows users to output their reports in various formats, including PDF, HTML, Excel, and more.
4/ Mobile Reporting: Style Report offers mobile reporting capabilities, allowing users to access and interact with reports on their devices.
5/ Report Distribution: Users can distribute reports via email, FTP, or a shared network drive.
Positives and negatives of the tool:
Pros
- Customizable dashboards enable users to create personalized views of their data.
- Interactive reports allow users to filter, sort, and explore data in real-time.
- It has the ability to seamlessly integrate with a wide range of data sources.
- Mobile reporting capabilities allow users to access reports with ease.
- Intuitive report designer with drag-and-drop functionality makes report creation quick and easy.
Cons
- The tool may lack advanced predictive analytics capabilities, which may be a limitation for users who require predictive modeling.
- The tool offers only a limited free trial period, which may not be sufficient for some users to fully evaluate the software.
Pricing Plan: Growth $165/mth billed annually, Enterprise- Contact sale
Our experience with the tool: The user experience and level of support is quite good. The process of dragging data elements onto a dashboard and generating interactive visualizations is straightforward. Additionally, there is a wide range of elements available that has helped our team to effortlessly integrate them into the visualizations.
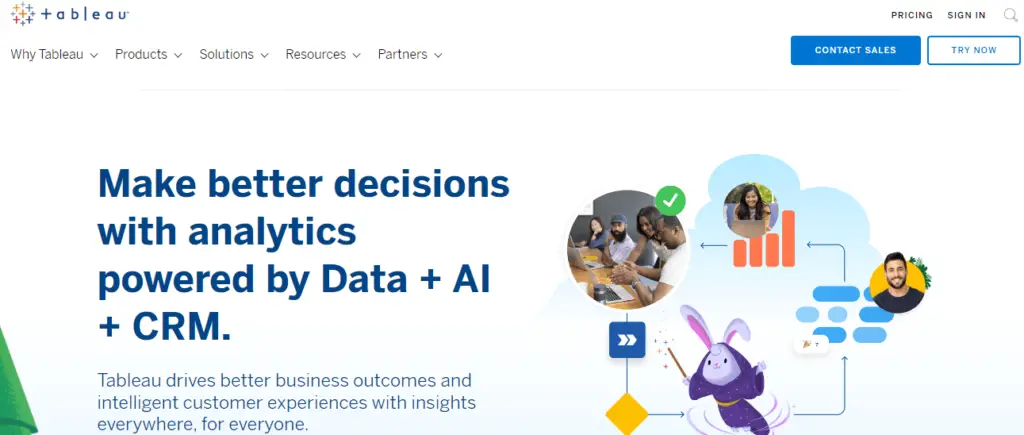
2) Tableau
Overview of the tool
Tableau is a powerful data visualization and business intelligence tool that empowers users to generate interactive reports, dashboards, and visualizations from multiple data sources. With its advanced drag-and-drop interface, users can effortlessly create reports and dashboards, even without extensive technical expertise, enabling efficient and rapid report creation.
Tableau provides a wide range of data connectors, including popular databases like SQL Server, MySQL, and Oracle. Additionally, users can also connect to spreadsheets, text files, and web-based data sources.
Features offered by Tableau
1/ Data preparation: Tableau has built-in data preparation capabilities that enable users to clean, shape, and transform their data before creating reports.
2/ Drag-and-drop interface: The software has an intuitive drag-and-drop interface that makes it easy to create reports and visualizations quickly
3/ Embedding options: Tableau enables users to embed reports and visualizations in other applications, making it easy to share insights with others.
4/ Large dataset processing: Tableau can handle large datasets and process data quickly, making it an ideal tool for analyzing large volumes of data.
5/ Analytics capabilities: Tableau includes advanced analytics capabilities, such as predictive modeling and statistical analysis, which enable users to gain deeper insights into their data.
Positives and negatives of the tool:
Pros
- Provides robust security features to ensure that reports and data are secure.
- Provides a range of customization options, allowing users to create highly specialized reports.
- Enables collaboration and teamwork through its sharing and embedding features.
Cons
- Tableau’s reporting options are focused primarily on visualizations and dashboards, and may not meet the needs of users looking for more traditional or structured report formats.
- It does not offer full offline functionality.
Pricing Plan: Offers three plans, Tableau Creator, Tableau Explorer, and Tableau Viewer.
Our experience with the tool: Our positives with the tool was the simplicity of uploading and preparing various data visualizations, charts, graphics, and dashboards. This platform easily integrates with popular data file formats like text, CSV, Excel, and Google Sheets, making it convenient for our work. We also believe that the availability of a free version with essential features makes it an ideal choice for small businesses.
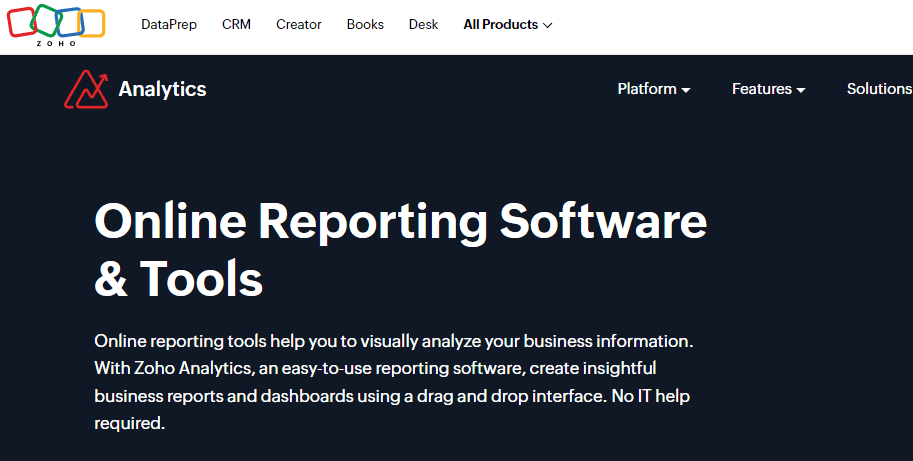
3) Zoho Reporting
Overview of the tool
Zoho Reporting is a cloud-based business intelligence and reporting tool that helps users create insightful reports and dashboards in minutes. One of the key benefits of Zoho Reporting is its data visualization capabilities, which enable users to present data in a visually appealing manner using charts, graphs, pivot tables, and tabular reports.
Zoho Reporting also offers a range of data integration options, allowing users to connect to a wide range of data sources, including cloud-based services like Google Drive and Dropbox.
Features offered by Zoho Reporting
1/ Automation: Zoho Reporting offers options for scheduling and automating report generation and distribution.
2/ Customization: Zoho Reporting allows users to customize their reports and dashboards to meet their specific requirements.
3/ Data Integration: Zoho Reporting allows users to import data from a wide range of sources, including spreadsheets, databases, cloud applications, and other third-party platforms.
4/ Security: Zoho Reporting offers strong security measures, including data encryption, two-factor authentication, and role-based access control, to guarantee the confidentiality and accuracy of data.
5/ API Integration: Zoho Reporting offers API integration with other third-party applications, allowing users to leverage their existing data and tools.
Positives and negatives of the tool
Pros
- Zoho Reporting has a user-friendly interface that makes it easy for users to create reports and dashboards.
- Mobile app: Zoho Reporting offers a mobile app for iOS and Android devices, enabling users to access their reports and dashboards on the go.
- Zoho Reporting offers affordable pricing plans that make it accessible to businesses of all sizes.
Cons
- Zoho Reporting has a limit on the amount of data that can be imported, which can make it unsuitable for businesses with very large datasets.
- Zoho Reporting offers a mobile app, but it does not have all the features available on the desktop version, which can be a challenge for users who need to access advanced reporting features.
Pricing Plan: Basic $14/mth, Standard $29/mth, Premium $63/mth, Enterprise $241/mth.
Our experience with the tool: One of the most useful features of Zoho Analytics is its ability to integrate with various data sources, providing an efficient means of centralizing and analyzing information within a single platform. Furthermore, the user interface is notably user-friendly, contributing to an overall positive experience.
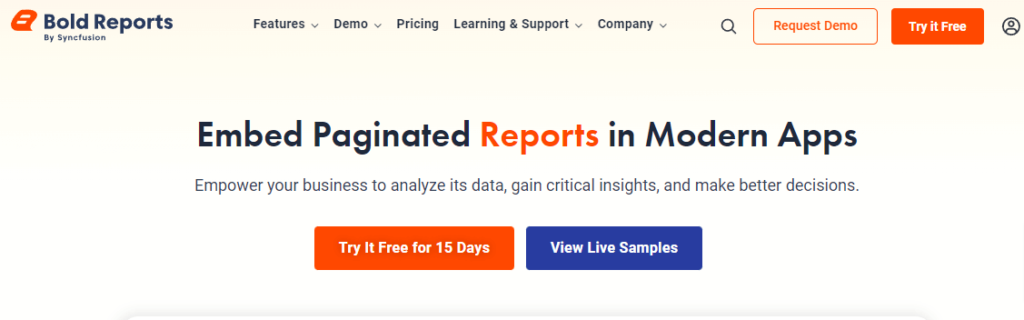
4) Bold Report by Syncfusion
Overview of the tool
Bold Report is a report drafting tool by Syncfusion that helps users create and design professional reports. It provides a range of customizable templates that can be tailored to match your branding or design requirements.
Additionally, Bold Report offers interactive report elements such as charts, tables, and graphs that make it easy to present your data in a visually appealing and meaningful way. You can also add multimedia elements such as hyperlinks and images to enhance your reports.
Features offered by Bold Report
1/ Mobile responsiveness: Bold Report provides mobile responsiveness, allowing your reports to be viewed on a variety of devices, from desktops to smartphones.
2/ Report sharing: Bold Report allows you to easily share reports with others via email, social media, or embedded links.
3/ Report exporting: Bold Report supports exporting reports to a variety of formats such as PDF, Excel, HTML, and CSV.
4/ Data connectivity: Bold Report offers support for a variety of data sources, including databases, spreadsheets, and cloud-based storage solutions.
5/ Customizable templates: Bold Report provides a range of customizable templates that can be tailored to match your branding or design requirements.
Positives and negatives of the tool
Pros
- Report scheduling allows reports to run automatically at specific times.
- The software features a user-friendly interface that is intuitive and effortless to navigate.
- 24×7 email and chat support.
- Allows free trial and demo versions, making it easier for users to try the software before purchasing it.
Cons
- It may not be suitable for creating complex reports with advanced data visualization requirements.
Pricing Plan: Cloud- Contact sale, Standard- Contact sale, Plus- Contact sale.
Our experience with the tool: We found the functionality of cloud reporting to be particularly noteworthy. The streamlined process of creating and modifying reports is highly effective and requires no additional software installations. Moreover, we are particularly fond of the interactive report feature, which facilitates the visual representation of data segmented by region.
5) Fast Reports

Overview of the tool
FastReport is a powerful reporting tool that can assist in report writing. The software’s drag-and-drop interface enables users to create and customize reports with ease, according to their specific needs. FastReport supports a wide range of data sources, including databases, XML, CSV, Excel, and more, enabling users to connect to their data sources and create reports based on the data.
It also provides a range of customization options, including the ability to add custom scripts, styles, and formatting options, enabling users to create reports that meet their specific requirements.
Features offered by Fast Reports
1/ Report Localization: FastReport enables users to create reports in different languages, making it ideal for organizations that operate in multiple regions.
2/ Data Sorting and Grouping: FastReport allows users to sort and group data in reports, making it easy to analyze and understand large datasets.
3/ Report Preview: FastReport allows users to preview reports before exporting them to different formats, ensuring that the reports look the way they want them to.
4/ Report Designer: FastReport provides a powerful report designer that allows users to create and customize reports according to their needs.
5/ Drill-Down Reports: FastReport supports drill-down reports, which allow users to click on a report element to see detailed information about it.
Positives and negatives of the tool
Pros
- FastReport can quickly generate reports, making it ideal for time-sensitive projects.
- FastReport provides a range of customization options, including the ability to add custom scripts, styles, and formatting options, making it easy to create reports that meet specific requirements.
- FastReport supports a wide range of data sources, making it easy to connect to different databases and data formats.
Cons
- FastReport is not a free tool and requires a license to use. The cost may be a barrier for some users or organizations.
- FastReport does not have a large support community, which means that finding help or solutions to problems may be challenging.
Pricing Plan: Requires Purchase of License- Contact Sales
Our experience with the tool: After trying Fast Report, the primary possitve of the tool is it provides comprehensive exporting capabilities, allowing us to save reports in multiple formats such as PDF, Excel, and HTML. Additionally its user-friendly interface, extensive data connectivity options, and comprehensive exporting capabilities, serves as a valuable solution for organizations looking to create visually appealing reports.
6) Visme Business Report Maker
Overview of the tool
Visme Business Report Maker is a cloud-based software tool that enables users to create professional-looking formal business reports quickly and easily. Its drag-and-drop interface helps to create and customize reports with speed and ease.
Users can add images, text, and other elements to their reports, and customize them according to their branding and requirements. Moreover, Visme provides users with a diverse selection of customizable templates, serving as a convenient starting point for report design and saving valuable time and effort.
Features offered by Visme Business Report Maker
1/ Analytics: Visme provides analytics and insights into how viewers interact with reports, enabling users to make data-driven decisions.
2/ Customer Support: Visme offers multiple customer support options, including email support, live chat, and an extensive knowledge base, ensuring that users have various channels to seek assistance and guidance.
3/ Branding Options: Visme allows users to customize their reports with their branding, including colors, logos, and fonts.
4/ Data Visualization Tools: Users can easily import data from Excel, Google Sheets, or other data sources, and create charts, and graphs.
5/ Customizable Templates: Visme provides users with a wide variety of customizable templates that serve as a valuable starting point for report design, effectively reducing the time and effort required to create visually appealing reports.
Positives and negatives of the tool
Pros
- Visme has a range of interactive elements that can be added to reports, including animations, hover effects, and clickable links, making reports more engaging and interactive.
- Visme integrates with a range of third-party tools, including HubSpot, Salesforce, and Zapier, making it easy to connect with other business systems.
- Visme offers a range of pricing plans designed to cater to diverse business needs and budgets, including a free plan that provides limited features to accommodate various requirements.
Cons
- Visme is a cloud-based tool, which means that users need an internet connection to access it.
- Limited support for non-English languages.
Visme Business Report Maker is completely free.
Our experience with the tool: According to our experience with the tool, the biggest plus point of Visme business report maker is that its a free tool allowing users to create visually appealing and interactive reports without requiring extensive design or technical skills.
7) Databox
Overview of the tool Databox is a reporting tool that allows users to create customized business reports in real-time. With Databox, users can easily connect to a variety of data sources, such as Google Analytics, Salesforce, and HubSpot, and create customizable reports and dashboards to track key business metrics.
The platform offers a variety of visualization options, including charts, graphs, and tables, as well as the ability to create custom KPIs and goals. Databox is a powerful tool for businesses looking to streamline their data reporting and gain insights into their performance.
Features offered by Databox
1/ Alerts and Notifications: Databox allows users to set up alerts and notifications to stay on top of changes in their data.
2/ White Labeling: Users can white-label their dashboards and reports to match their company’s branding.
3/ API Access: Databox provides API access, allowing users to integrate their data into custom applications.
4/ Customizable Dashboards: Users can create custom dashboards to visualize their data in a variety of ways, such as charts, graphs, and tables.
5/ Report sharing: Users can easily share reports and dashboards with team members or stakeholders, either through email or by embedding them in a website or app.
Positives and negatives of the tool
Pros
- Databox can be integrated with over 70 third-party data sources, making it easy for businesses to connect to their existing data systems.
- Databox has a user-friendly interface and offers a variety of customizable templates.
- Powerful data filtering and segmentation capabilities provide insights into data from different angles.
Cons
- Databox has limited support for non-English languages, which may be a drawback for businesses operating in non-English-speaking countries.
- The platform’s pricing model can be expensive for smaller businesses or those with limited budgets.
Pricing Plan: Starter $72/mth, Professional $135/mth, Performer $231/mth
Our experience with the tool: One of the aspects that we found particularly appealing about the Databox platform is its flexibility and easy to use interface. The platform offers an extensive selection of customizable dashboard configurations, allowing our team to customize their interface according to their unique preferences and requirements.
8) Ubiq
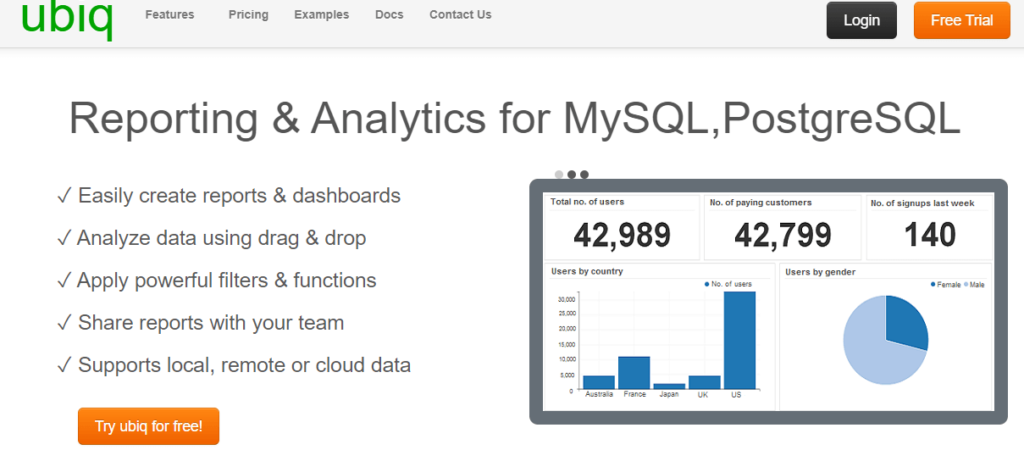
Overview of the tool
Ubiq is a powerful document-writing tool that provides a simple interface for creating reports. With Ubiq, users can easily connect to their data sources, visualize data, and create interactive reports in a matter of minutes. The tool has extensive support for various data sources, including spreadsheets, databases, and cloud services like Google Analytics and Salesforce.
Ubiq also makes it easy to collaborate on reports with other team members. Users can share reports with others, assign roles and permissions, and receive feedback in real time. This makes it easy to work on reports together and ensures that everyone is on the same page.
Features offered by Ubiq
1/ Data Source Connectivity: Ubiq supports various data sources such as spreadsheets, databases (MySQL, PostgreSQL, SQL Server, etc.), and cloud services like Google Analytics, Salesforce, and more
2/ Drag-and-Drop Report Builder: Ubiq presents users with a user-friendly interface that features a drag-and-drop report builder, making it effortless to create customized reports.
3/ Report Automation: Ubiq automates the process of data collection and report generation. It can automatically fetch data from multiple sources, consolidate it, and generate reports on a predefined schedule.
4/ Data Security and Access Control: Ubiq prioritizes data security by providing role-based access control and ensuring data encryption during transmission and storage.
5/ Data Filters and Parameters: Users can define filters and parameters within reports to create dynamic and personalized views of the data.
Positives and negatives of the tool
Pros
- Ubiq automates data collection and report generation, saving users time and effort by eliminating manual data gathering and report creation tasks.
- Ubiq facilitates collaboration among team members by allowing easy sharing of reports, assigning roles, and providing real-time access, enhancing teamwork efficiency.
- Ubiq supports the creation of real-time dashboards that provide instant visibility into key performance indicators (KPIs) and data trends, aiding quick decision-making.
Cons
- Ubiq’s pricing structure may not be suitable for all budgets, especially for small businesses or individuals looking for more cost-effective solutions.
- Ubiq primarily operates online, which means offline access to reports and data may not be available, restricting usability in certain situations.
Pricing Plan: Individual $29/mth, Small Teams $59/mth, Medium Teams $89/mth, Large Teams $149/mth, Very Large Teams $299/mth.
Our experience with the tool: One of the key advantages of Ubiq is its ability to integrate with MySQL, along with its helpful cloud support. Additionally, Ubiq’s user-friendly interface requires minimal coding expertise, enabling our team members to easily generate informative and intuitive charts for their data.
9) Datapine
Overview of the tool
Datapine is a business intelligence tool that helps users to create, manage, and share data-driven reports and dashboards. The tool’s reporting functionality allows users to generate visually appealing reports with just a few clicks, eliminating the need for manual report creation.
Datapine offers a range of data visualization options such as charts, graphs, and tables, which can be customized to suit specific business needs. Users can also apply filters, drill down into data, and perform calculations and aggregations to uncover hidden patterns and trends.
Features offered by Datapine
1/ Drag-and-Drop Report Builder: The tool comes with a drag-and-drop interface functionality, enabling users to effortlessly generate reports and dashboards without requiring technical expertise or coding skills.
2/ Customization and Formatting: Users have the flexibility to customize and format their reports according to their specific requirements. They can adjust colors, fonts, labels, and other visual elements to create personalized and branded reports.
3/ Advanced-Data Analysis: Datapine provides advanced data analysis capabilities, including filtering, aggregation, calculations, and drill-downs.
4/ Data Alerts: Users can set up data alerts to receive notifications when specific data thresholds or conditions are met.
5/ Performance Monitoring: Datapine provides performance monitoring features to track key performance indicators (KPIs) and measure the effectiveness of business metrics.
Positives and negatives of the tool
Pros
- Datapine provides a wide range of customizable data visualization options, allowing users to create visually appealing and impactful reports.
- Users can enhance the context and clarity of reports by adding annotations, comments, and explanations, creating compelling data narratives.
- The tool is scalable, accommodating the needs of both small businesses and enterprise-level organizations.
Cons
- Datapine’s pricing structure may not be suitable for all budgets, particularly for smaller businesses or individuals seeking more cost-effective solutions.
- As an online tool, Datapine relies on a stable internet connection, which may cause limitations or interruptions without reliable internet access.
Pricing Plan: Basic $249/mth, Professional $449/mth, Premium $799/mth, Branding & Embedded $1099/mth.
Our experience with the tool: The platform interface has enabled members of our team to efficiently create dashboards and utilize them as a resource during various meetings. The tool’s pre-designed templates have further facilitated the process of generating reports. In essence, this software has significantly enhanced the efficiency of our work processes.
10) Ateb-Suitability
Overview of the tool
Ateb Suitability is a software tool designed to help financial advisors create comprehensive and compliant reports for their clients. The tool provides an automated, step-by-step process that guides advisors through the report-writing process, ensuring that all necessary information is included and presented in a clear and concise manner.
The Ateb Suitability tool includes a variety of features that can help streamline the report-writing process. For example, the tool provides a comprehensive questionnaire that advisors can use to gather information about their clients’ financial situations, risk tolerance, and investment goals. The tool then uses this information to generate a customized report that is tailored to each client’s specific needs and preferences.
Features offered by Ateb Compliance
1/ Questionnaire: Ateb Suitability includes a comprehensive questionnaire that advisors can use to gather client information, such as financial details, risk tolerance, and investment goals.
2/ Templates and Report Layouts: Ateb Suitability provides a range of templates and report layouts that advisors can utilize to create professional and visually appealing reports.
3/ Document Storage and Management: Ateb Suitability allows advisors to store and manage client documents securely within the tool.
4/ Audit Trail: Ateb Suitability maintains an audit trail, documenting actions and changes made throughout the report writing process, ensuring transparency and accountability.
5/ Training and Support: Ateb Suitability offers training and support resources to help advisors maximize their usage of the tool and address any questions or issues that may arise.
Positives and negatives of the tool
Pros
- The tool is scalable and can accommodate the needs of both individual advisors and larger organizations.
- Ateb Suitability offers integration capabilities with other software systems, facilitating data exchange and workflow efficiency.
- The tool includes built-in compliance checks, helping advisors ensure that their reports meet industry regulations and best practices.
Cons
- The cost of Ateb Suitability may be a consideration, particularly for smaller financial advisory firms or individual advisors with limited budgets.
Pricing Plan: Classic Mortgage 31/mth, Classic Investment 35/mth, Zenith Mortgage 50/mth, Zenith Investment 75/mth.
Extra Learnings: Technical report writing software
1/ Microsoft Word: Microsoft Word is a widely used and versatile word-processing software that offers extensive formatting options, collaborative features, and compatibility with various platforms. It provides a range of tools for creating detailed and precise technical reports.
2/ Adobe InDesign: Adobe InDesign is a professional-grade desktop publishing software that provides advanced design and layout features. It is ideal for creating visually appealing technical reports with complex layouts, graphics, and illustrations.
3/ Google Docs: Google Docs is a cloud-based word processing tool that facilitates collaborative editing, real-time commenting, and seamless sharing of documents. While it may not have all the advanced technical features of other software, it is a convenient option for collaborative writing and basic technical reports.
When selecting the best technical report writing software, consider factors such as the specific requirements of your technical content, collaboration needs, document complexity, and the availability of specialized features for your industry or field of expertise.
Advantages of writing tools for reports
There are many advantages of utilizing report-writing tools in a business context. These tools enhance productivity, accuracy, collaboration, customization, and data visualization.
By leveraging such software and tools, businesses can streamline their report-writing processes, and make informed decisions based on reliable and well-presented information. In this context let’s go through some of the primary benefits of report-writing tools:
- Collaboration and Accessibility: Report writing software facilitates seamless collaboration among team members. Multiple users can work on the same report simultaneously, reducing time delays and enhancing productivity.
- Enhanced Accuracy: Report writing software and tools provide features like spell-check, grammar-check, and auto-correction, ensuring the accuracy of the content. These tools help identify errors, inconsistencies, and formatting issues, minimizing the risk of producing imperfect reports.
- Customization and Flexibility: Many report writing tools offer customization options, allowing writers to tailor reports to specific needs or audiences.
- Enhanced Report Tracking and Analytics: Some report drafting tools provide additional features for tracking and analytics, enabling businesses to monitor the performance and usage of reports.
Features to Look for in Report Writing Software
When selecting report-writing software, consider the features that align with your specific needs and requirements. By choosing the right software, you can improve the quality of your reports, and enhance collaboration within your organization. Below is the list of the top 5 features to consider:
1/ Automated Data Analysis: Automated data analysis is a vital feature to look for. The software should possess the capability to import and analyze data from diverse sources, including spreadsheets, databases, and other software applications, enabling comprehensive data analysis and integration.
2/ Templates and Formatting: Look for software that provides a comprehensive library of report templates and formatting options. Templates can save you time by offering pre-designed layouts tailored to different types of reports.
3/ Collaboration and Sharing: Collaboration and sharing features are essential in report writing software. The software should have real-time editing, commenting, and version control features that enable teams to work together simultaneously, provide feedback, and make necessary revisions.
4/ Security and Data Privacy: Reports often contain sensitive and confidential information, so it is crucial to prioritize software that offers robust security measures. Look for features like data encryption, user access controls, and secure sharing options.
5/ Analytics and Insights: Analytics and insights features are valuable in reporting software. The software should provide insights into metrics like report views, engagement, and user feedback, helping organizations understand the impact of their reports.
What are the 4 methods of a report?
There are different methods or approaches to reporting writing, each suited for specific purposes and contexts. In this section, we will explore the four primary methods of report writing.
1/ Narrative Reports: Narrative reports are the most common and widely used method of report writing. They present information in a chronological or logical sequence, following a storytelling format.
2/ Analytical Reports: Analytical reports focus on data analysis and provide insights and recommendations based on the findings. These reports go beyond simply presenting information and aim to interpret and evaluate data to support decision-making with the help of SaaS analytics.
3/ Technical Reports: Technical reports are highly detailed and specialized documents that focus on technical information, such as scientific research, engineering projects, or complex processes.
4/ Feasibility Reports: Feasibility reports assess the viability and practicality of a project or idea. These reports are commonly used in business settings to evaluate potential investments, new product development, or process improvements.
What is project report software?
Project report software is a specialized tool designed to assist in the creation, management, and presentation of project reports. It is a digital solution that streamlines the process of compiling, organizing, and analyzing project data to generate comprehensive reports.
This software is specifically tailored to meet the unique reporting needs of project management professionals, teams, and stakeholders. Moreover, if you’re pursuing a project management course, using such tools can greatly enhance your reporting skills in real-world scenarios.
Frequently Asked Questions
Q1) Which software is used for report writing?
Ans: The software that is frequently used for report writing includes Zoho Analytics, Google data studio, and Intsoft. These applications offer a wide range of formatting and editing features that facilitate the creation of professional-looking reports.
Q2) What is the best tool for reporting?
Ans: Some popular options for the best reporting tool include Microsoft Power BI, Tableau, and Google Data Studio. These tools offer advanced data visualization, analysis, and reporting capabilities, empowering users to create insightful and interactive reports.
Q3) Which software can be used for making a report?
Ans: Zoho reporting software is one of the best report-making software that helps users create insightful reports and dashboards in minutes.
Q4) Which is the best software for report writing?
Ans: Tableau, Google Analytics, Bold Report, Databox, and Zoho Analytics are the best software for report writing. They offer a comprehensive set of features, extensive formatting options, and compatibility with various platforms, making them a reliable choice for creating professional reports.